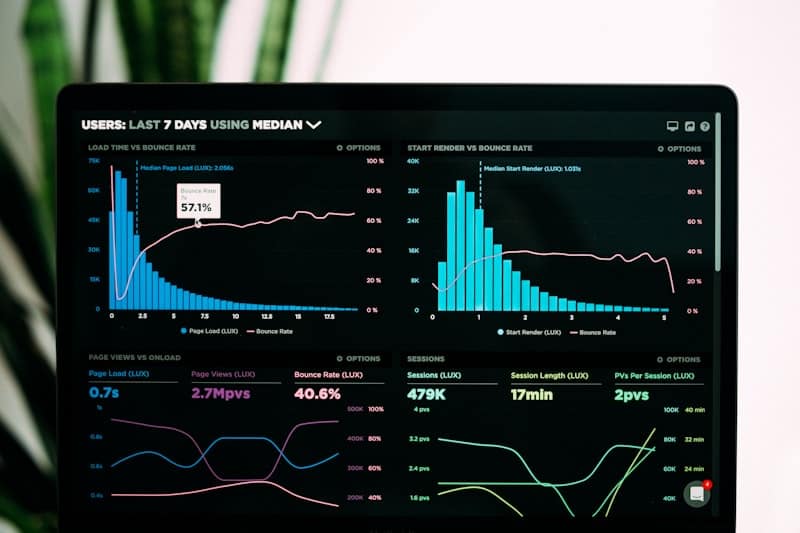
Designed and built an internal analytics dashboard consolidating data from five business units. Features live data streaming via Server-Sent Events, customisable widget grids, role-based access control, and PDF export with Puppeteer.
Leadership was pulling KPIs from four separate BI tools across five business units — a process taking 3+ hours of manual collation every Monday morning. Data was often stale by the time it reached decision-makers, and there was no single source of truth.
Built a unified React dashboard with a drag-and-drop widget grid (react-dnd), live KPI streaming via Server-Sent Events, role-based access so each team sees only their data, and one-click PDF export via Puppeteer. A nightly ETL job in Node.js pulls from all five data sources into a single Postgres schema.
Monday morning reporting time dropped from 3 hours to 12 minutes. Leadership now has live data with <5 minute lag instead of 24-hour staleness. The dashboard replaced four separate BI tool subscriptions, saving ~$28k/year in software costs.